A modern interface, faster reports, and more powerful audience insights
Here at Airtime Pro, we don’t just listen. We also hear. That’s why we’ve rolled out an updated version of listener statistics – changes to the platform that are based on feedback from broadcasters and users like you.
While the overall structure will feel familiar, the update introduces enhanced reporting features alongside a more responsive, modern interface. Best of all, they’ll make everyday analytics clearer, faster, and easier to share with royalty agencies.
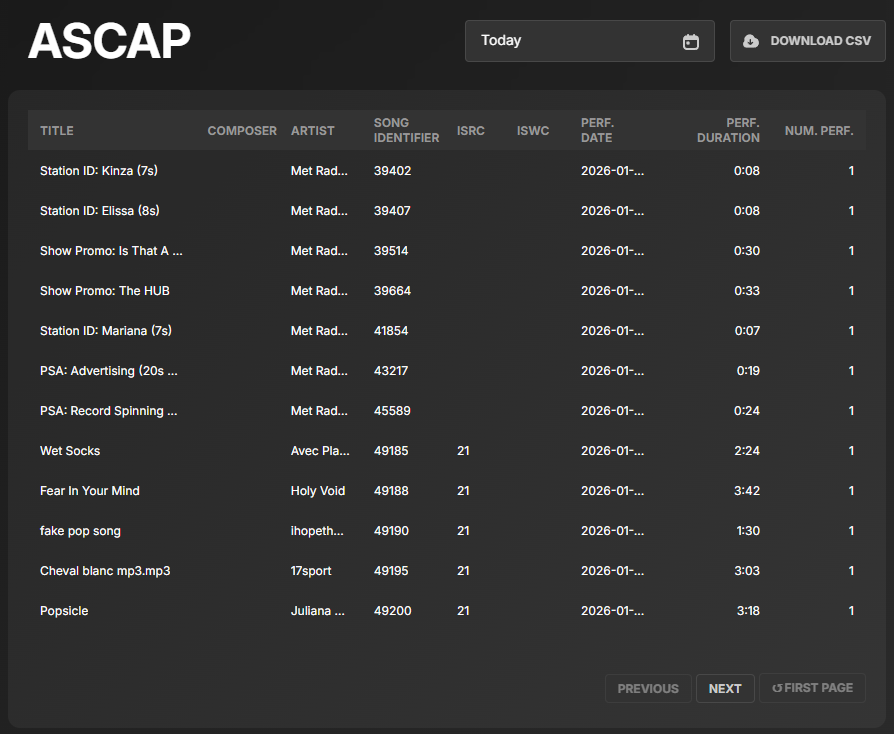
Built-in ASCAP and Tracks report
The most significant change is the addition of two dedicated report streams: ASCAP and Tracks.
If your station plays copyrighted music, you’re usually required to report how that music is used so royalties can be paid correctly. This is where ASCAP and Tracks reports come in.
Both reports can be downloaded directly as CSV files in royalty-agency-friendly formats and submitted to the relevant agencies. This removes a significant amount of manual work and makes royalty reporting more straightforward, particularly useful for stations broadcasting music regularly.
The updated statistics now include listener metrics per track in the Tracks report. You can see minimum, maximum, and average listener counts for individual tracks, giving you a clearer view of how your audience responds to specific music selections.
A more detailed, intuitive statistics experience
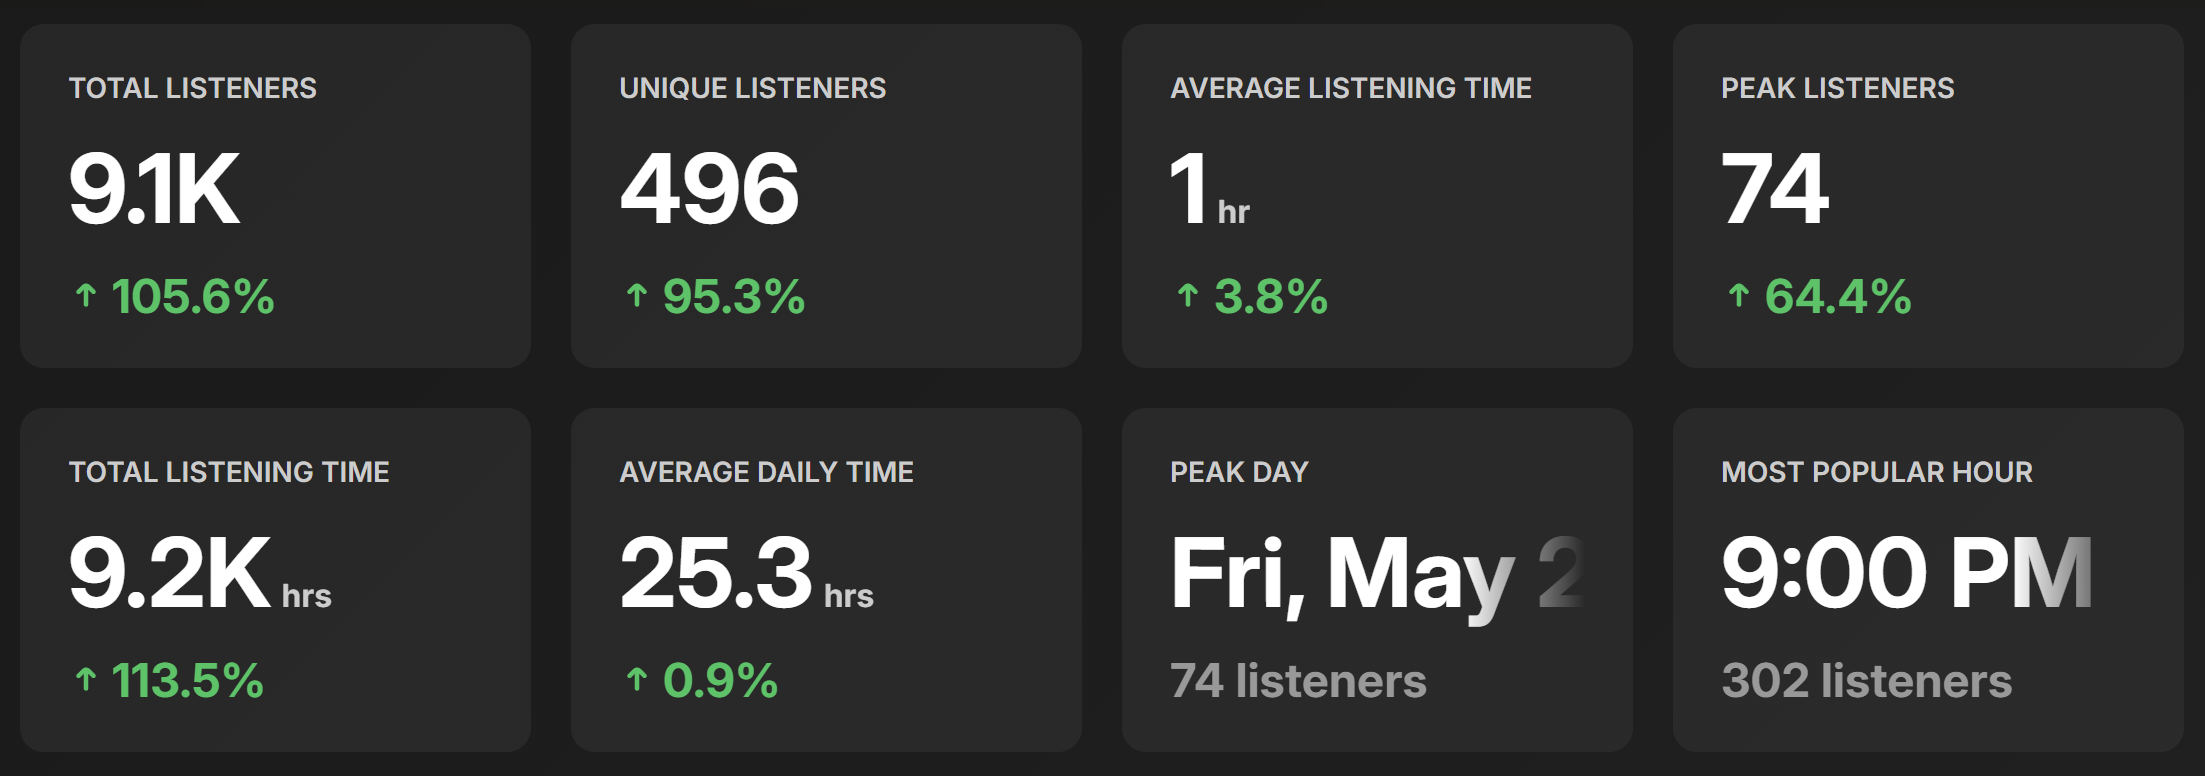
Beyond reporting, the listener stats module has been given a refreshed look to make data easier to read, faster to load, and quicker to action.
Listener data can now be viewed by cities (in addition to states and regions), with interactive maps highlighting areas where your audience is listening the most.
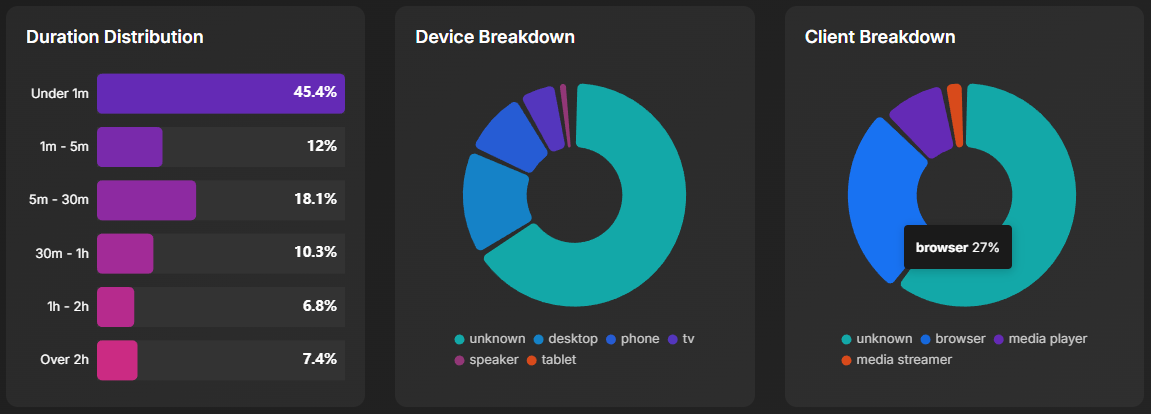
The update also introduces additional listener breakdowns that weren’t previously available, including:
- Device breakdown: Easily see what devices listeners are using
- Client breakdown: Understand how listeners are connecting
- Session length and duration distribution: See how long listeners stay tuned in; track listening patterns over time
- Per-stream statistics: View listener data by individual stream
These insights are especially useful for stations running multiple streams (such as different formats) and want to better understand listener behaviour and technical use.
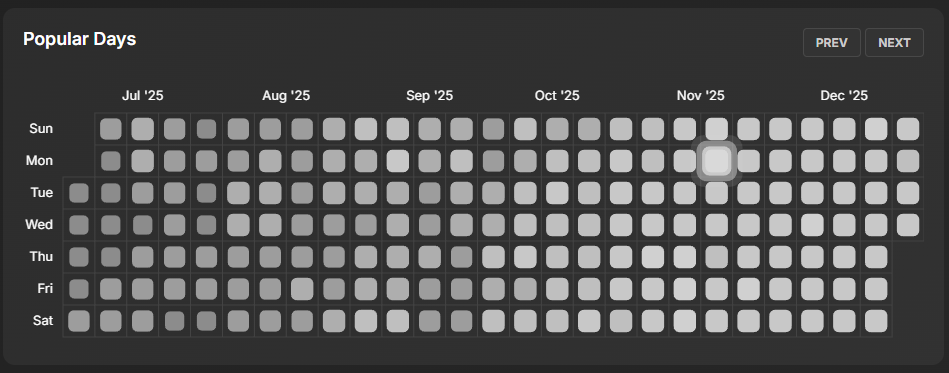
A weekly heatmap now shows peak hours by day, making it easy to spot your audience’s most active listening times.
Try It for Yourself
These updates require no back-end toggling; they’re already loaded. The next time you log into your Airtime Pro dashboard and visit the Analytics section, your data will already be there, waiting to reveal insights you might not have noticed before.
Of course, change isn’t for everyone; you can also continue using the old stats viewer, as it will remain available during the transition period. But we’re confident that once you see what’s possible with the updated listener stats, you won’t want to go back.
These updates build on the existing statistics rather than replacing them. Core analytics features remain in place. What’s new are tools focused on speed, clarity, usability, and utility. The new features give you a clear picture of your audience, highlighting listening habits and trends so you can optimise your programming and simplify reporting.
If you have any questions or feedback, please get in touch. Your input helps us keep improving.
Simplify reporting and understand your audience better.
Try Airtime Pro today!
7 day free trial, no credit card required
Plans from $9.95/mo
Leave a Reply